Wine Statistics
The latest data on worldwide and US wine production, wine sales, wine consumption, wineries, and the wine industry during the coronavirus pandemic.
Wine is one of life's great pleasures. It's also a big business, employing nearly 1 million people worldwide and generating more than $350 billion in sales every year.
Pop a cork, pour a (responsibly-sized) glass, and join us on this tour of impressive, surprising, and fun statistics about the world of wine.
IN THIS ARTICLE:
Want personalized wines?
Get your first box of wines for $44.95 + free shipping.

How Big Is the Wine Industry?
839,908 people are employed in the wine industry worldwide. (IBISWorld)
There are 90,086 wineries in the world. (IBISWorld)
The market size of all global wine manufacturers is $315 billion. (IBISWorld)
Wine Production Statistics
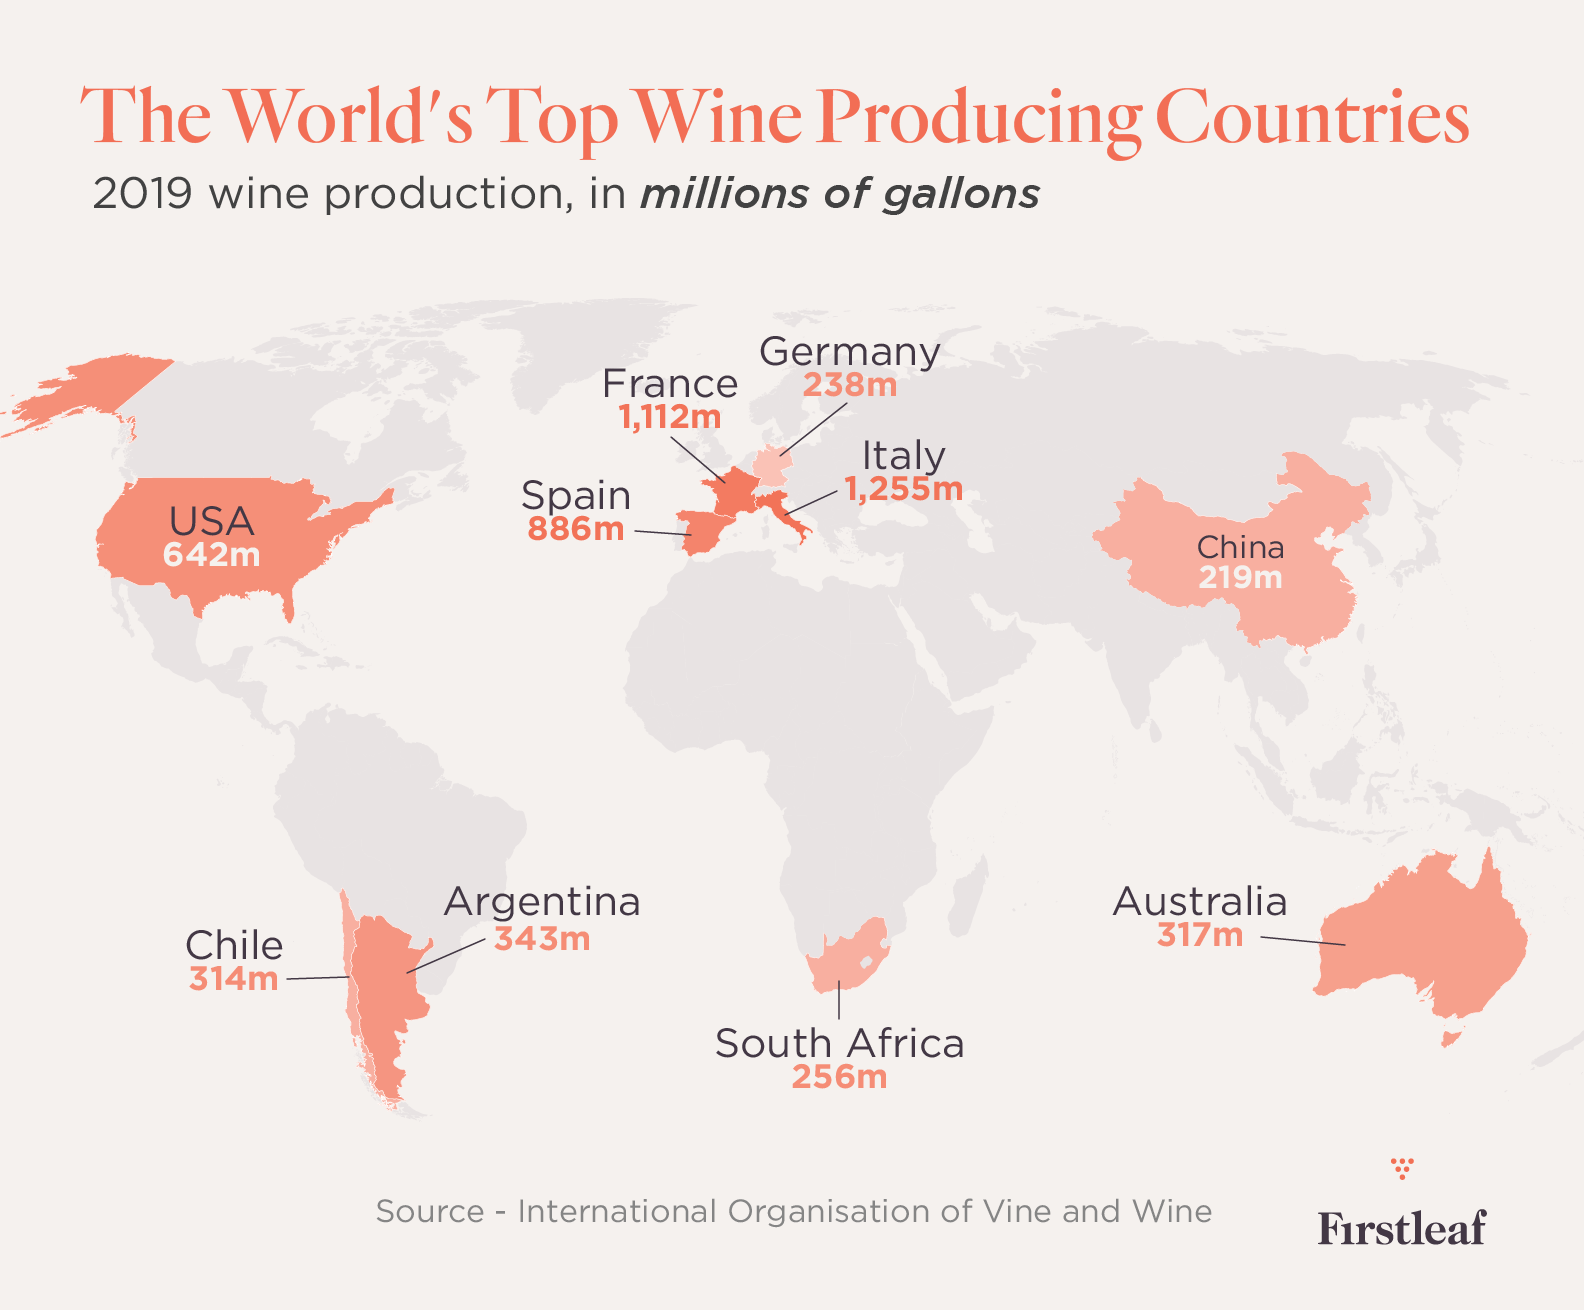
The top wine-producing countries in the world are Italy, France, and Spain according to the International Organisation of Vine and Wine. The United States is in fourth place, producing about half as much wine as first place Italy.
According to the International Organisation of Vine and Wine, these are the top 10 wine-producing countries in the world for 2019 (in millions of gallons).
Italy: 1,255
France: 1,112
Spain: 886
United States: 642
Argentina: 343
Australia: 317
Chile: 314
South Africa: 256
Germany: 238
China: 219
United States Wine Production Statistics
Wines Vines Analytics pegs overall U.S. wine production slightly higher at 332 million cases of wine or 789 million gallons.
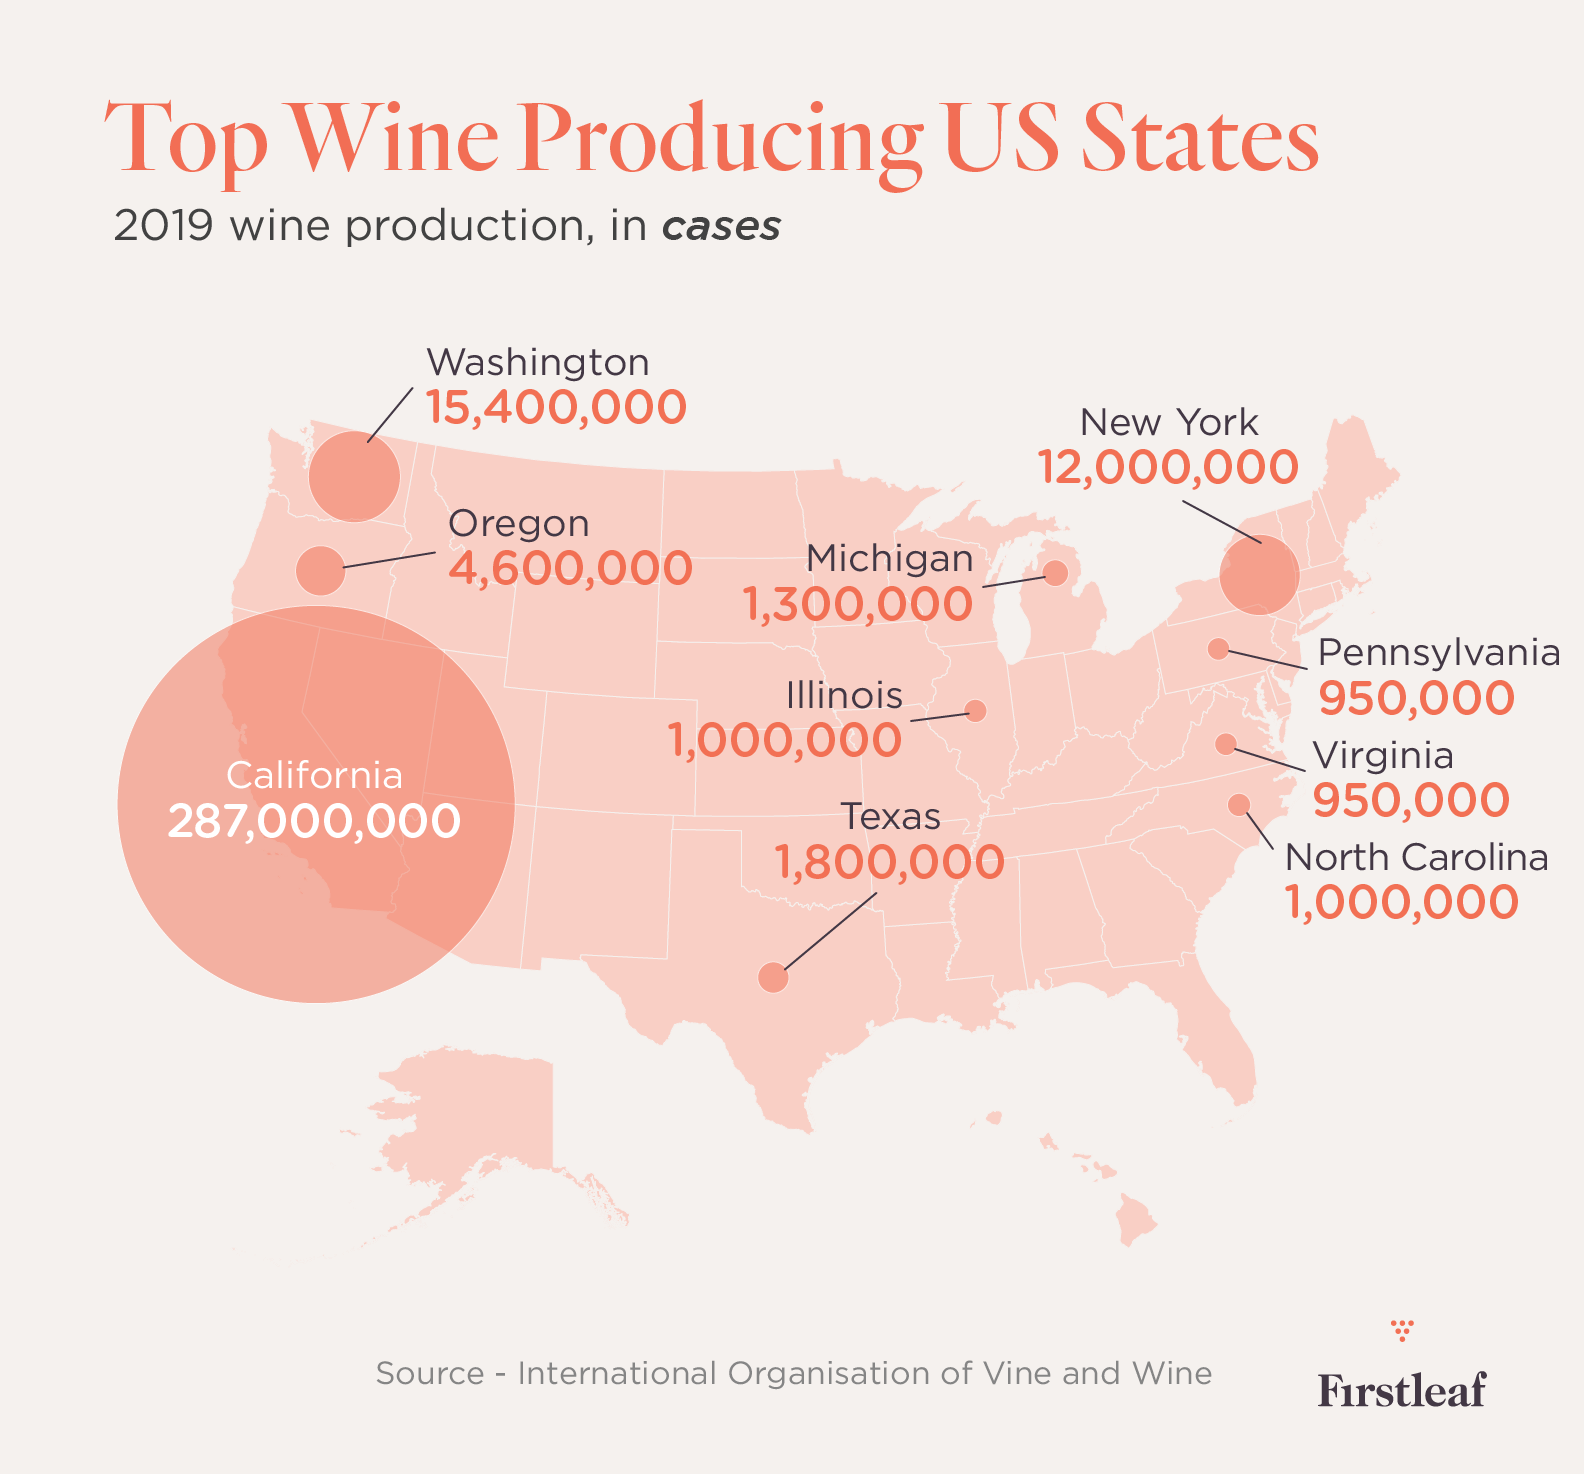
According to Wines Vines Analytics, these are the top 10 wine-producing states for 2019 in cases of wine produced.
California: 287,000,000
Washington: 15,400,000
New York: 12,000,000
Oregon: 4,600,000
Texas: 1,800,000
Michigan: 1,300,000
Illinois: 1,000,000
North Carolina: 1,000,000
Pennsylvania: 950,000
Virginia: 950,000
California wineries account for 86% of U.S. wine production. (Wines Vines Analytics)
Wine Consumption Statistics
The areas that produce the most wine aren't the ones that drink the most of it, according to statistics from the International Organisation of Vine and Wine.
What Country Consumes the Most Wine?
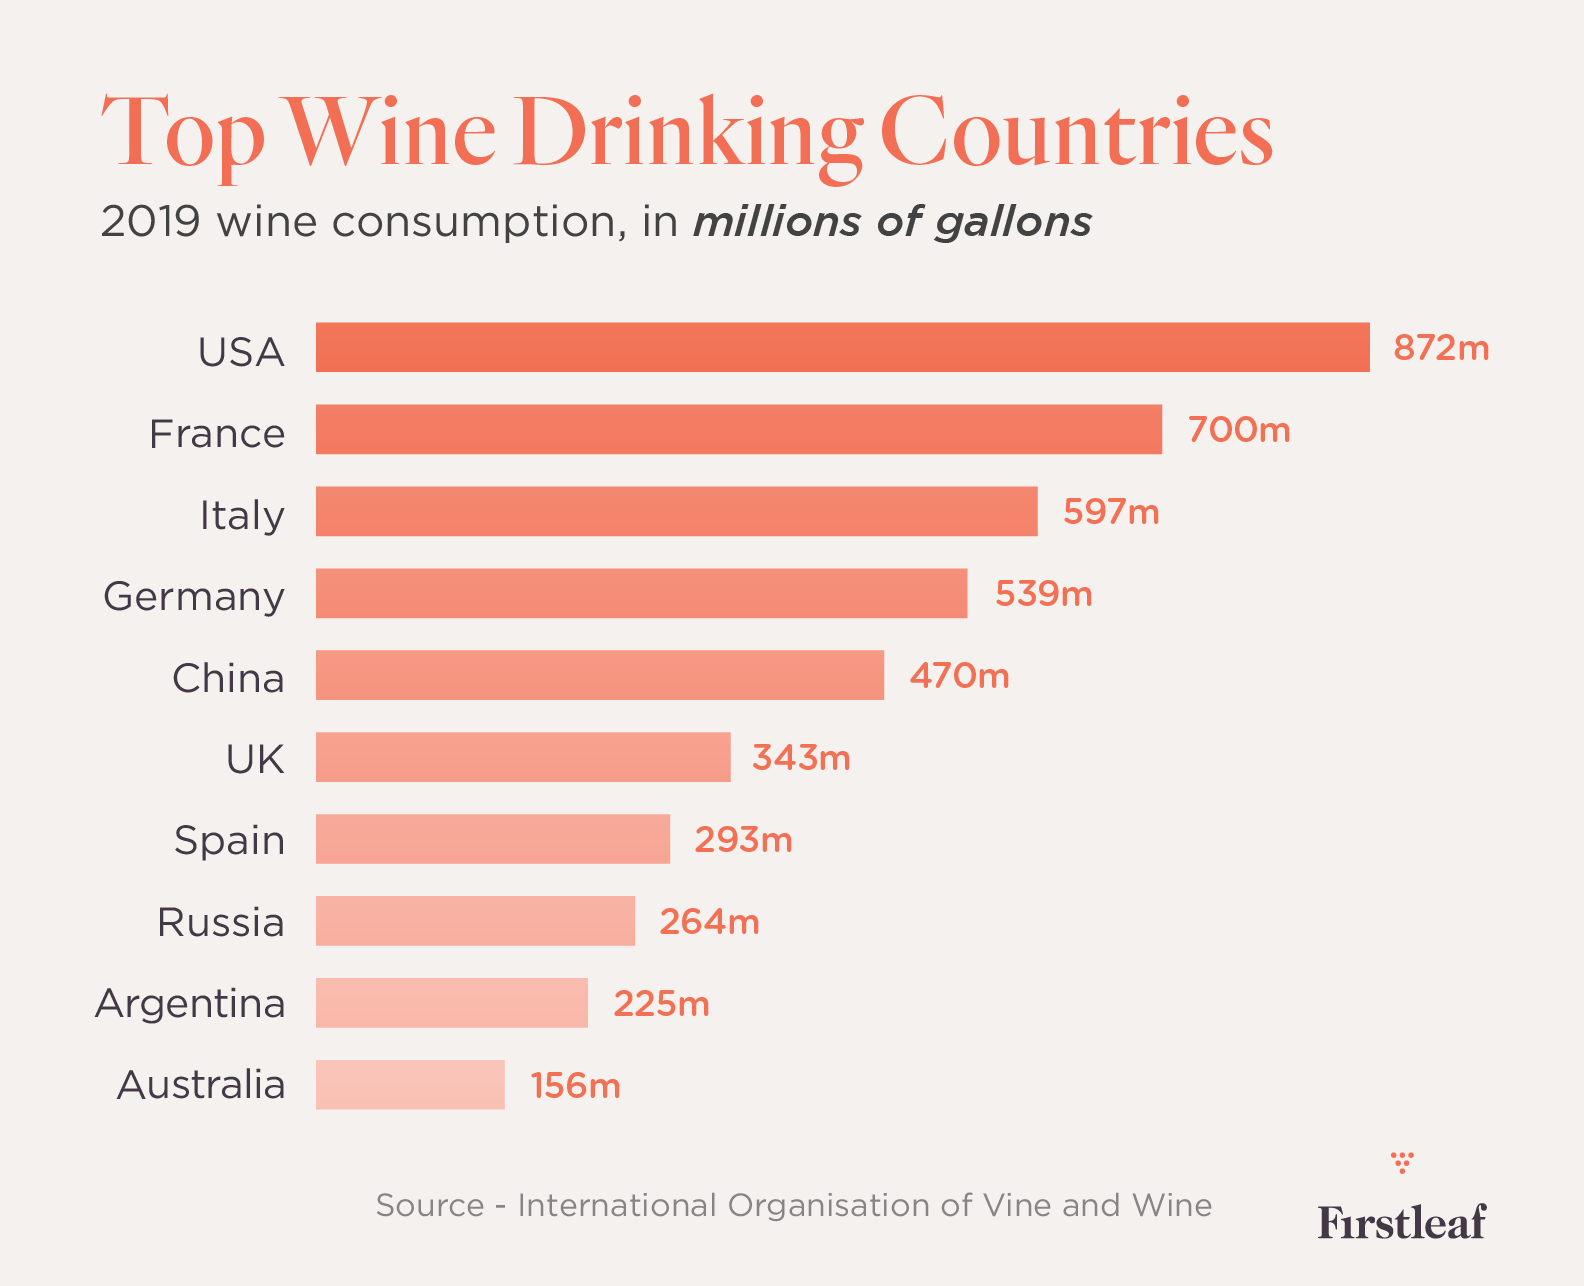
According to the International Organisation of Vine and Wine, these countries consumed the most wine by volume in 2019 (in millions of gallons):
United States: 872
France: 700
Italy: 597
Germany: 539
China: 470
United Kingdom: 343
Spain: 293
Russia: 264
Argentina: 225
Australia: 156
Fun Fact
The United States is responsible for drinking the most wine overall, but, per person, residents of Portugal drink more wine than those of any other major wine-drinking country.
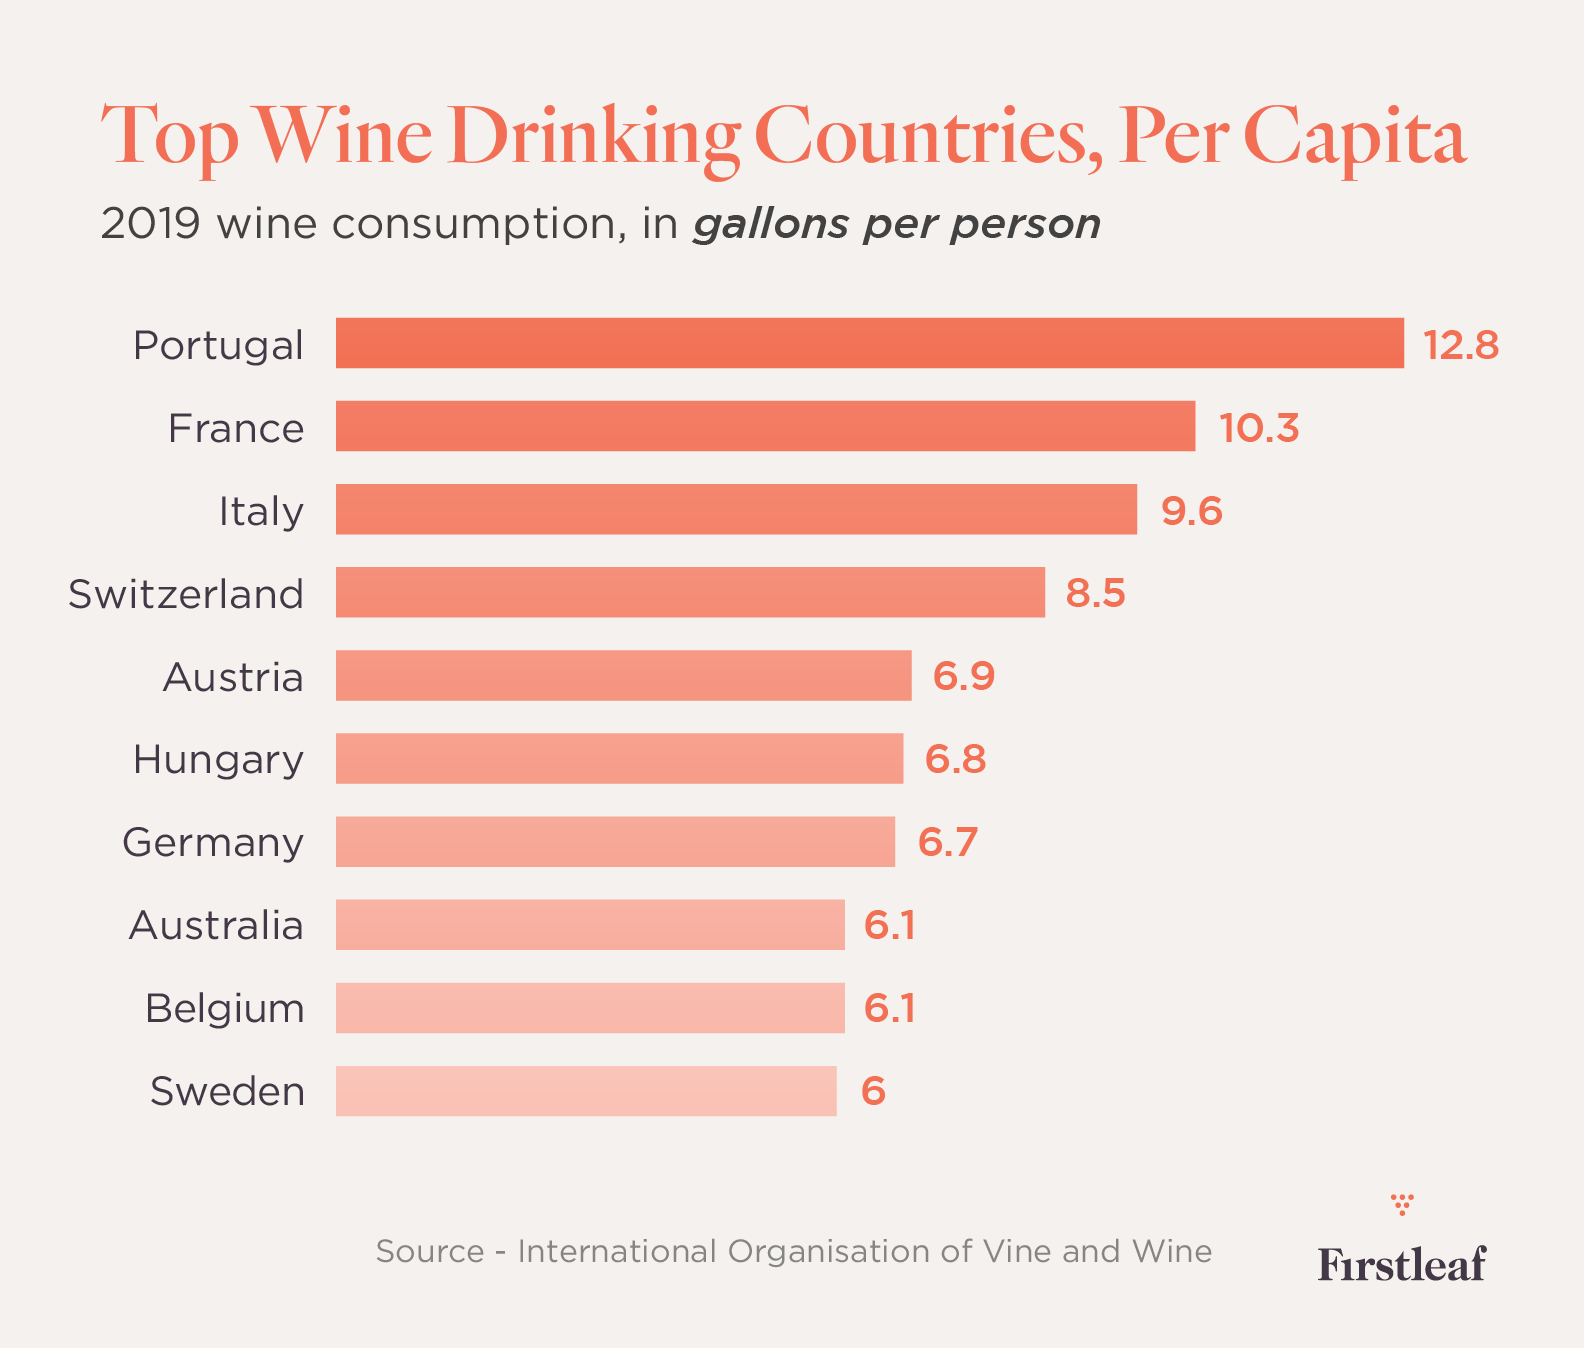
When you factor in population, the list looks a little different. Based on the International Organisation of Vine and Wine numbers, these are the countries whose residents drink the most gallons of wine per person.
Portugal: 12.8
France: 10.3
Italy: 9.6
Switzerland: 8.5
Austria: 6.9
Hungary: 6.8
Germany: 6.7
Australia: 6.1
Belgium: 6.1
Sweden: 6.0
Among major wine-drinking countries, the United States is 21st in per person consumption, drinking 13.2 bottles of wine per person.
What US State Consumes the Most Wine?
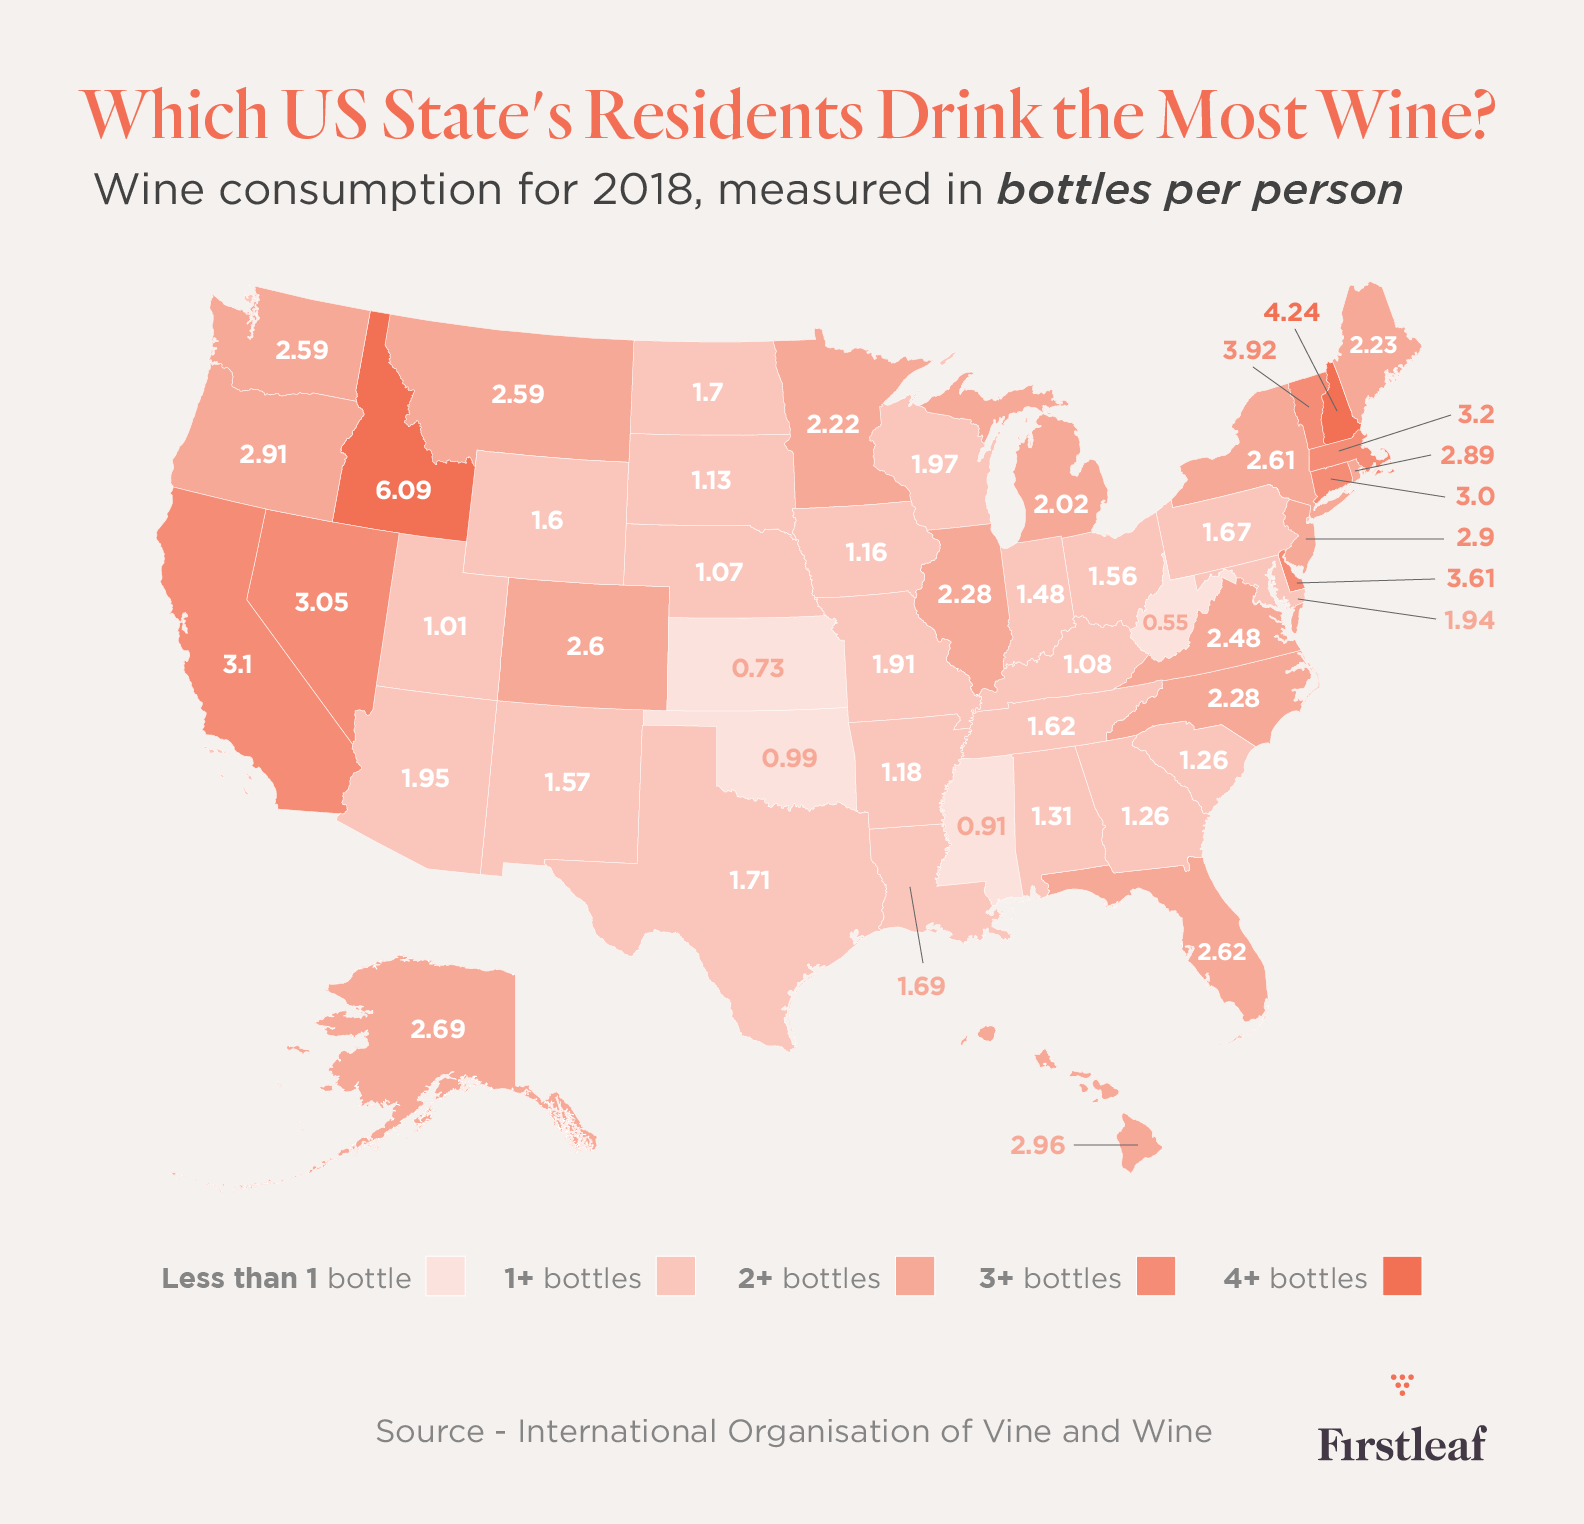
The state of California is responsible for drinking the most wine overall, but per person, the residents of Idaho drink more wine than those of any other state.
According to the National Institutes of Health, these states consumed the most wine by volume in 2019 (in thousands of gallons).
California: 155,591
Florida: 72,669
New York: 65,759
Illinois: 36,981
New Jersey: 33,015
North Carolina: 30,159
Massachusetts: 28,859
Pennsylvania: 27,721
Virginia: 26,950
Michigan: 25,903
Here are the states whose residents drink the most wine per person (in gallons per capita).
Idaho: 1.209
New Hampshire: 0.841
Vermont: 0.777
Delaware: 0.717
Massachusetts: 0.635
California: 0.616
Nevada: 0.605
Connecticut: 0.595
Hawaii: 0.587
Oregon: 0.578
Wine Sales Statistics
Total worldwide sales of wine amounted to $354.7 billion according to research by Statista.
Global Wine Sales Statistics
This list ranks the top 10 largest wine markets in the world by revenue.
United States: $47.8 billion
France: $27.4 billion
Italy: $26.1 billion
China: $25.5 billion
United Kingdom: $23.6 billion
Germany: $16.9 billion
Canada: $16.3 billion
Argentina: $14.1 billion
Indonesia: $12.2 billion
Russia: $11.8 billion
Wine has been traded between countries for at least 2,000 years. These statistics reveal the scope and nature of today's wine exports.
Total worldwide exports of wine amounted to $37.1 billion. (International Organisation of Vine and Wine)
Total worldwide exports of bottled wine amounted to $25.9 billion. (International Organisation of Vine and Wine)
Total worldwide exports of sparkling wine amounted to $7.3 billion. (International Organisation of Vine and Wine)
Total worldwide exports of bulk and boxed wine amounted to $3.9 billion. (International Organisation of Vine and Wine)
The most expensive wine ever sold at auction, a bottle of 1945 Romanee-Conti French Burgundy, cost $558,000 at a 2018 auction. (CNBC)
US Wine Sales Statistics
Research by Dr. Liz Thach, a distinguished professor of wine and a professor of management at Sonoma State University, pegged the U.S. wine sales revenue at $72.4 billion for 2019. According to the Wine Institute, U.S. wine exports are valued at $1.4 billion.
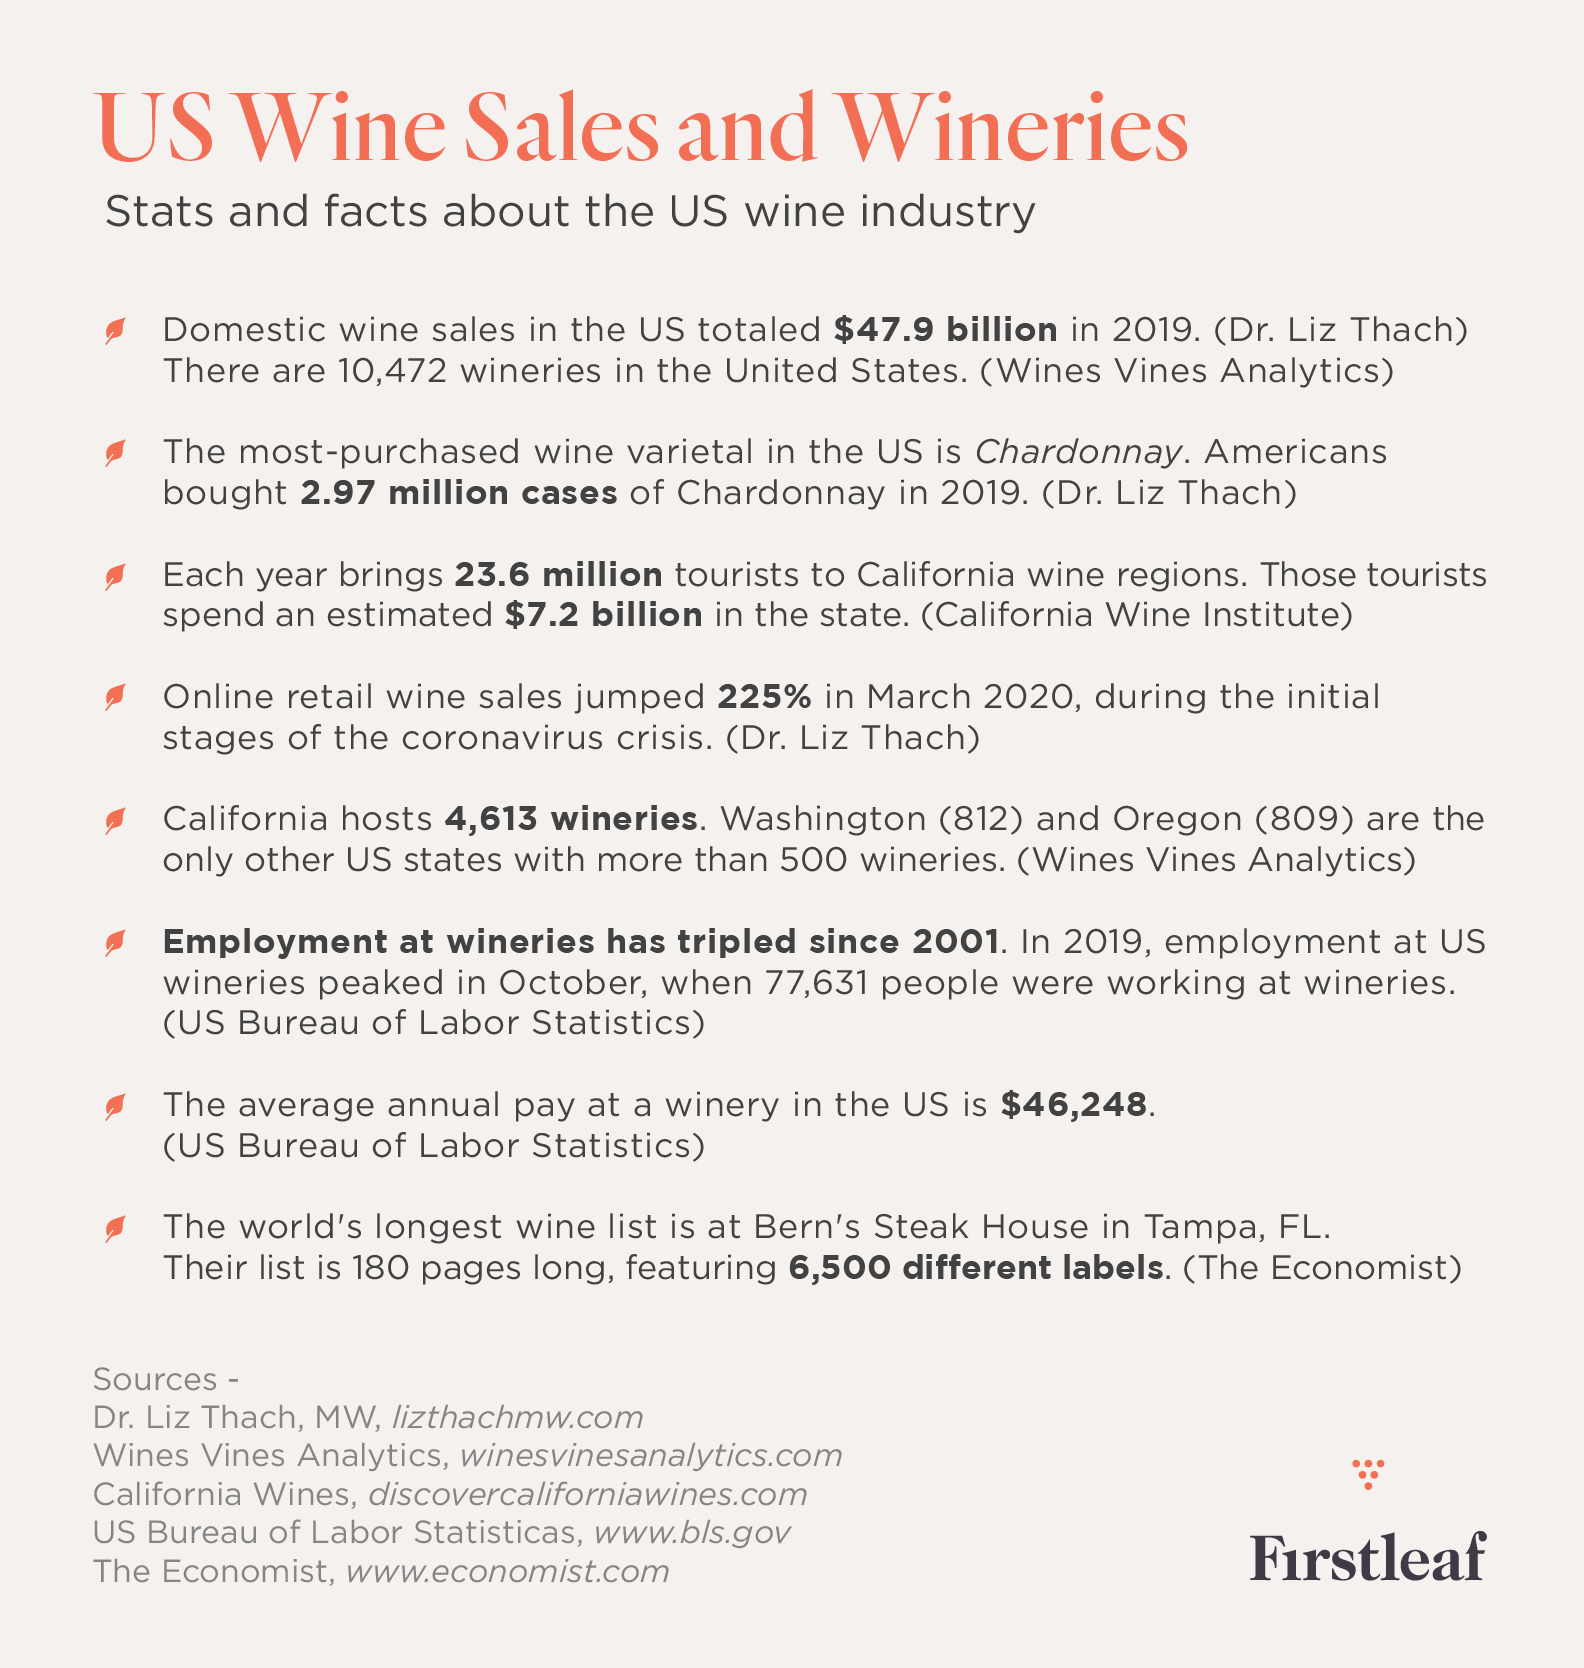
Domestic wine sales in the United States totaled $47.9 billion (Dr. Liz Thach)
Imported wine sales in the United States totaled $24.5 billion (Dr. Liz Thach)
The world's longest wine list, at Bern's Steak House in Tampa, Florida., is 180 pages long, featuring 6,500 different labels. (The Economist)
The most-purchased wine varietal in the United States is Chardonnay. Americans bought 2.97 million cases of Chardonnay in 2019. (Dr. Liz Thach)
Among U.S. wineries, the most common average bottle price is between $20 and $29.99. Of wines sold by U.S. wineries, 32% fall into this price category. (Wines/Vines Analytics)
The Wine Industry During the Coronavirus Pandemic
With many restaurants closed and people spending more time at home, certain types of wine sales saw a big boost during 2020.
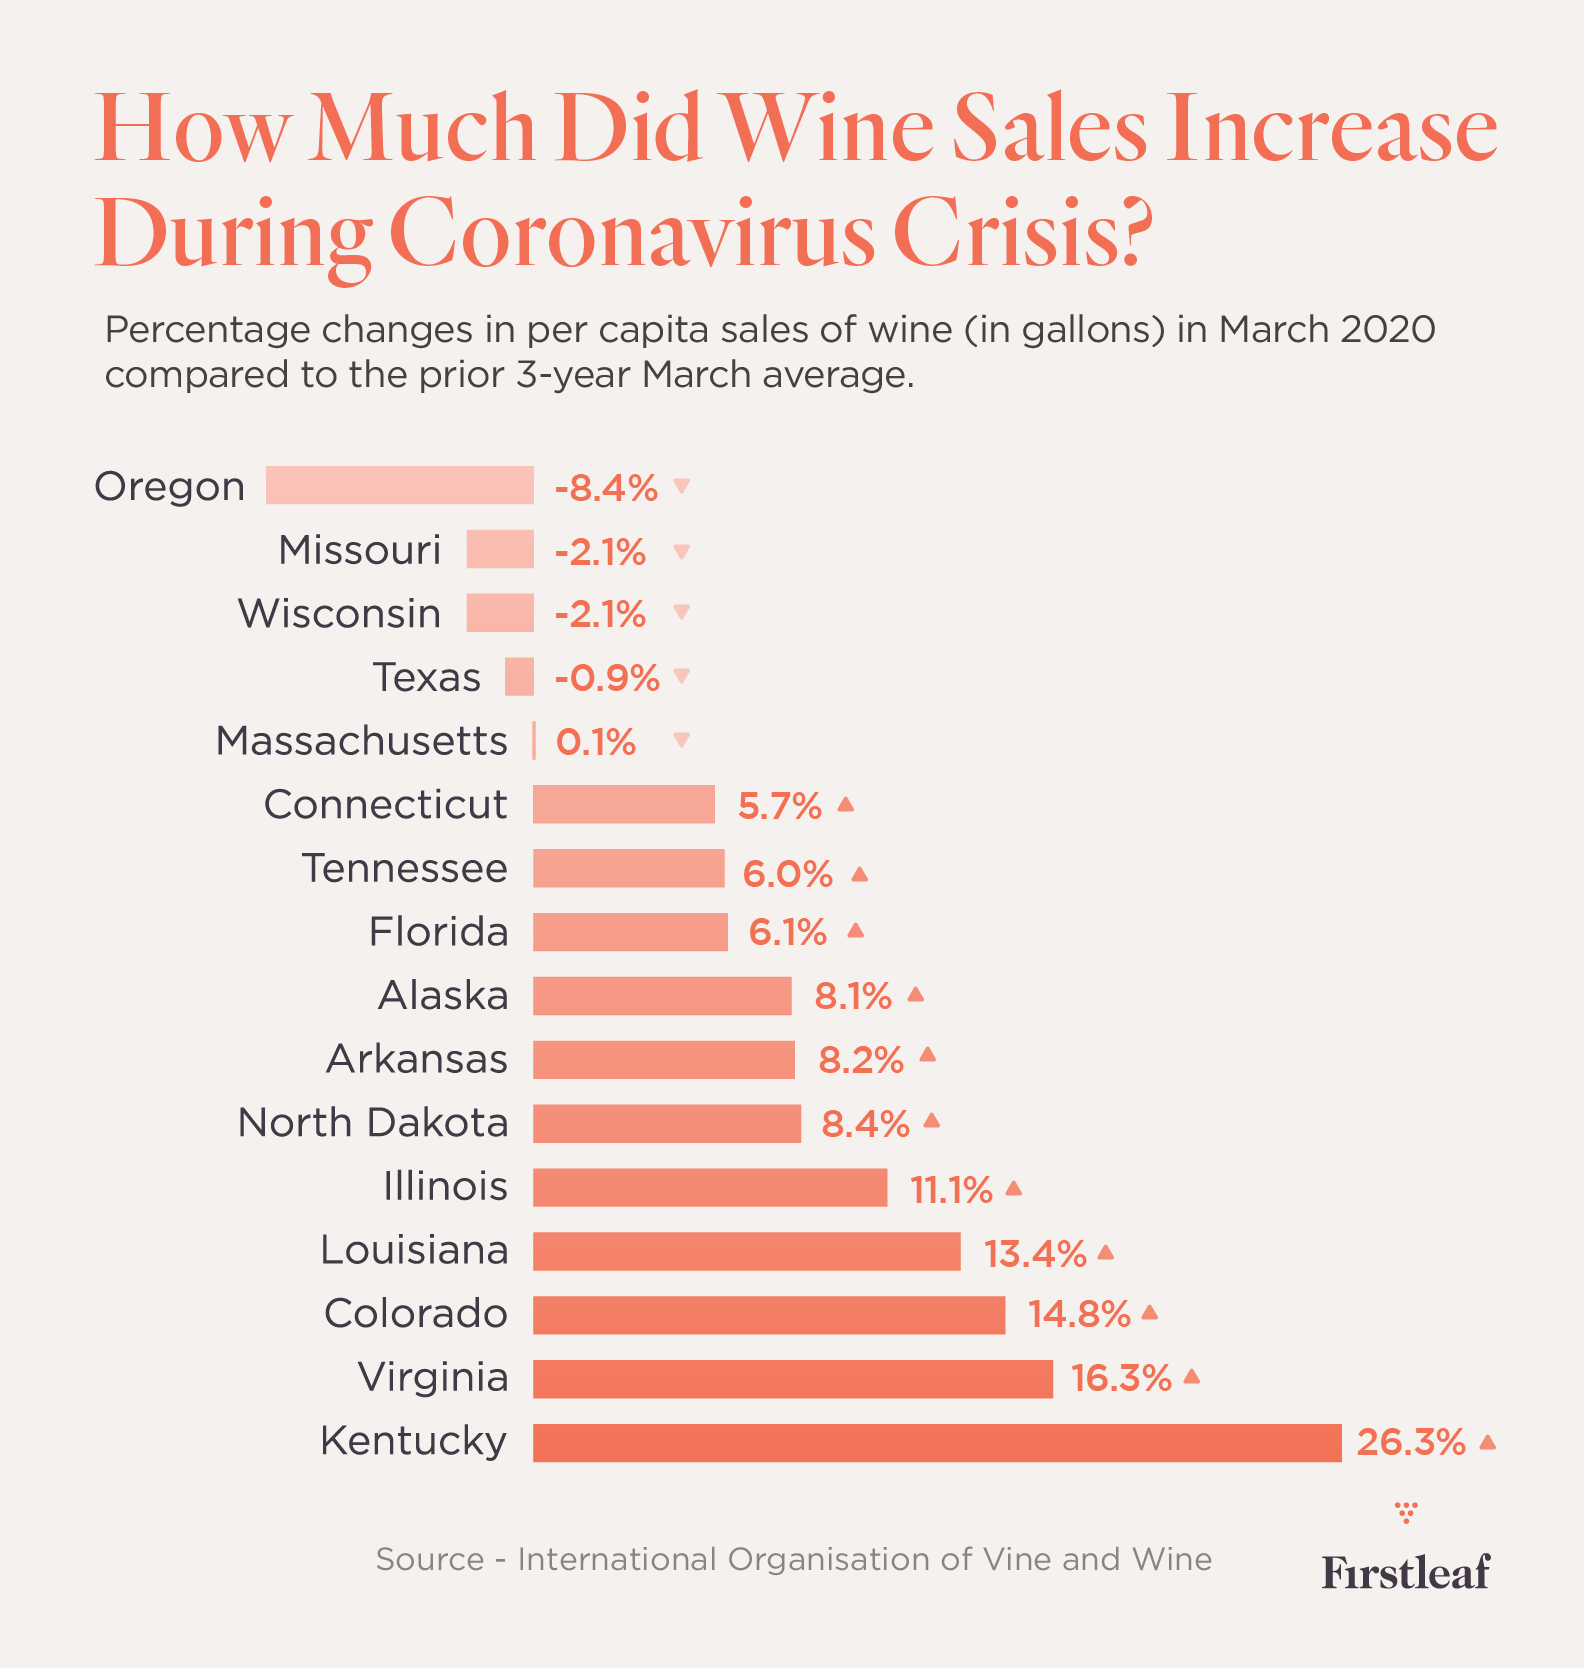
Of the 16 states tracked by the National Institutes for Health's Alcohol Epidemiologic Data System, 12 saw increases in wine sales in March 2020 compared to the March average for the prior three years.
Alaska: 8.1%
Arkansas: 8.2%
Colorado: 14.8%
Connecticut: 5.7%
Florida: 6.1%
Illinois: 11.1%
Kentucky: 26.3%
Louisiana: 13.4%
Massachusetts: 0.1%
Missouri: -2.1%
North Dakota: 8.4%
Oregon: -8.4%
Tennessee: 6.0%
Texas: -0.9%
Virginia: 16.3%
Wisconsin: -2.1%
Off-premise wine sales increased 66% by the end of the week of March 21, 2020, during the initial stages of the coronavirus crisis. (Dr. Liz Thach)
Online retail wine sales jumped 225% in March 2020, during the initial stages of the coronavirus crisis. (Dr. Liz Thach)
Wine Tourism Statistics
Wine tourism is a popular way to discover new wines and new places. With more than 10,000 wineries in the United States, plus thousands more in Europe, the possible itineraries are limitless.
There are 10,472 wineries in the United States. (Wines Vines Analytics)
California wine tourism is the most robust, the state hosts 4,613 wineries. (Wines Vines Analytics)
Each year brings 23.6 million tourists to California wine regions. Those tourists spend an estimated $7.2 billion in the state. (California Wine Institute)
Washington (812) and Oregon (809) are the only other states with more than 500 wineries. (Wines Vines Analytics)
In 2019, employment at U.S. wineries peaked in October, when 77,631 people were working at wineries. (U.S. Bureau of Labor Statistics)
Employment at wineries has tripled since 2001. (U.S. Bureau of Labor Statistics)
U.S. winery workers are paid a total of $3.3 billion in wages. (U.S. Bureau of Labor Statistics)
The average annual pay at a winery in the United States is $46,248. (U.S. Bureau of Labor Statistics)
In 2016, more than 10 million wine tourists visited France. (Visit French Wine)
French wine tourists spent more than $6 billion. (Visit French Wine)
French citizens account for 58% of French wine tourism, foreigners make up 42% of the total. (Visit French Wine)
More than 21,000 Italian wineries open their doors to the public as of 2015. (International Journal of Wine Research)
Between 4 and 6 million people visit Italian wineries annually. (International Journal of Wine Research)
Sources
Global Wine Manufacturing Industry - Market Research Report, IBISWorld
State of the World Vitivinicultural Sector in 2019, International Organisation of Vine and Wine
Winery Statistics, Wines Vines Analytics
Apparent per Capita Alcohol Consumption: National, State, and Regional Trends, 1977–2018, National Institutes of Health
Revenue of the Wine Market Worldwide by Country in 2018, Statista
The U.S. Wine Industry in 2020, Dr. Liz Thach, MW
Wine Statistics, Wine Institute
The World’s Longest Wine List, The Economist
Statistics, California Wines
Current Employment Statistics, U.S. Bureau of Labor Statistics
Employment in Wineries up 153 Percent From 2001 to 2017, U.S. Bureau of Labor Statistics
Wine Tourism in France in Numbers, Visit French Wine
Wine Tourism in Italy, International Journal of Wine Research
IN THIS ARTICLE
Want personalized wines?
Get your first box of wines for $44.95 + free shipping.


WinePrint™ by Firstleaf
Are you looking to learn more about your wine preferences? Check out our Wine Print for an in-depth look at your personal tasting profile. Discover your favorite wines, varietals, regions, and tasting notes and get personalized recommendations wherever you are.
Learn More
